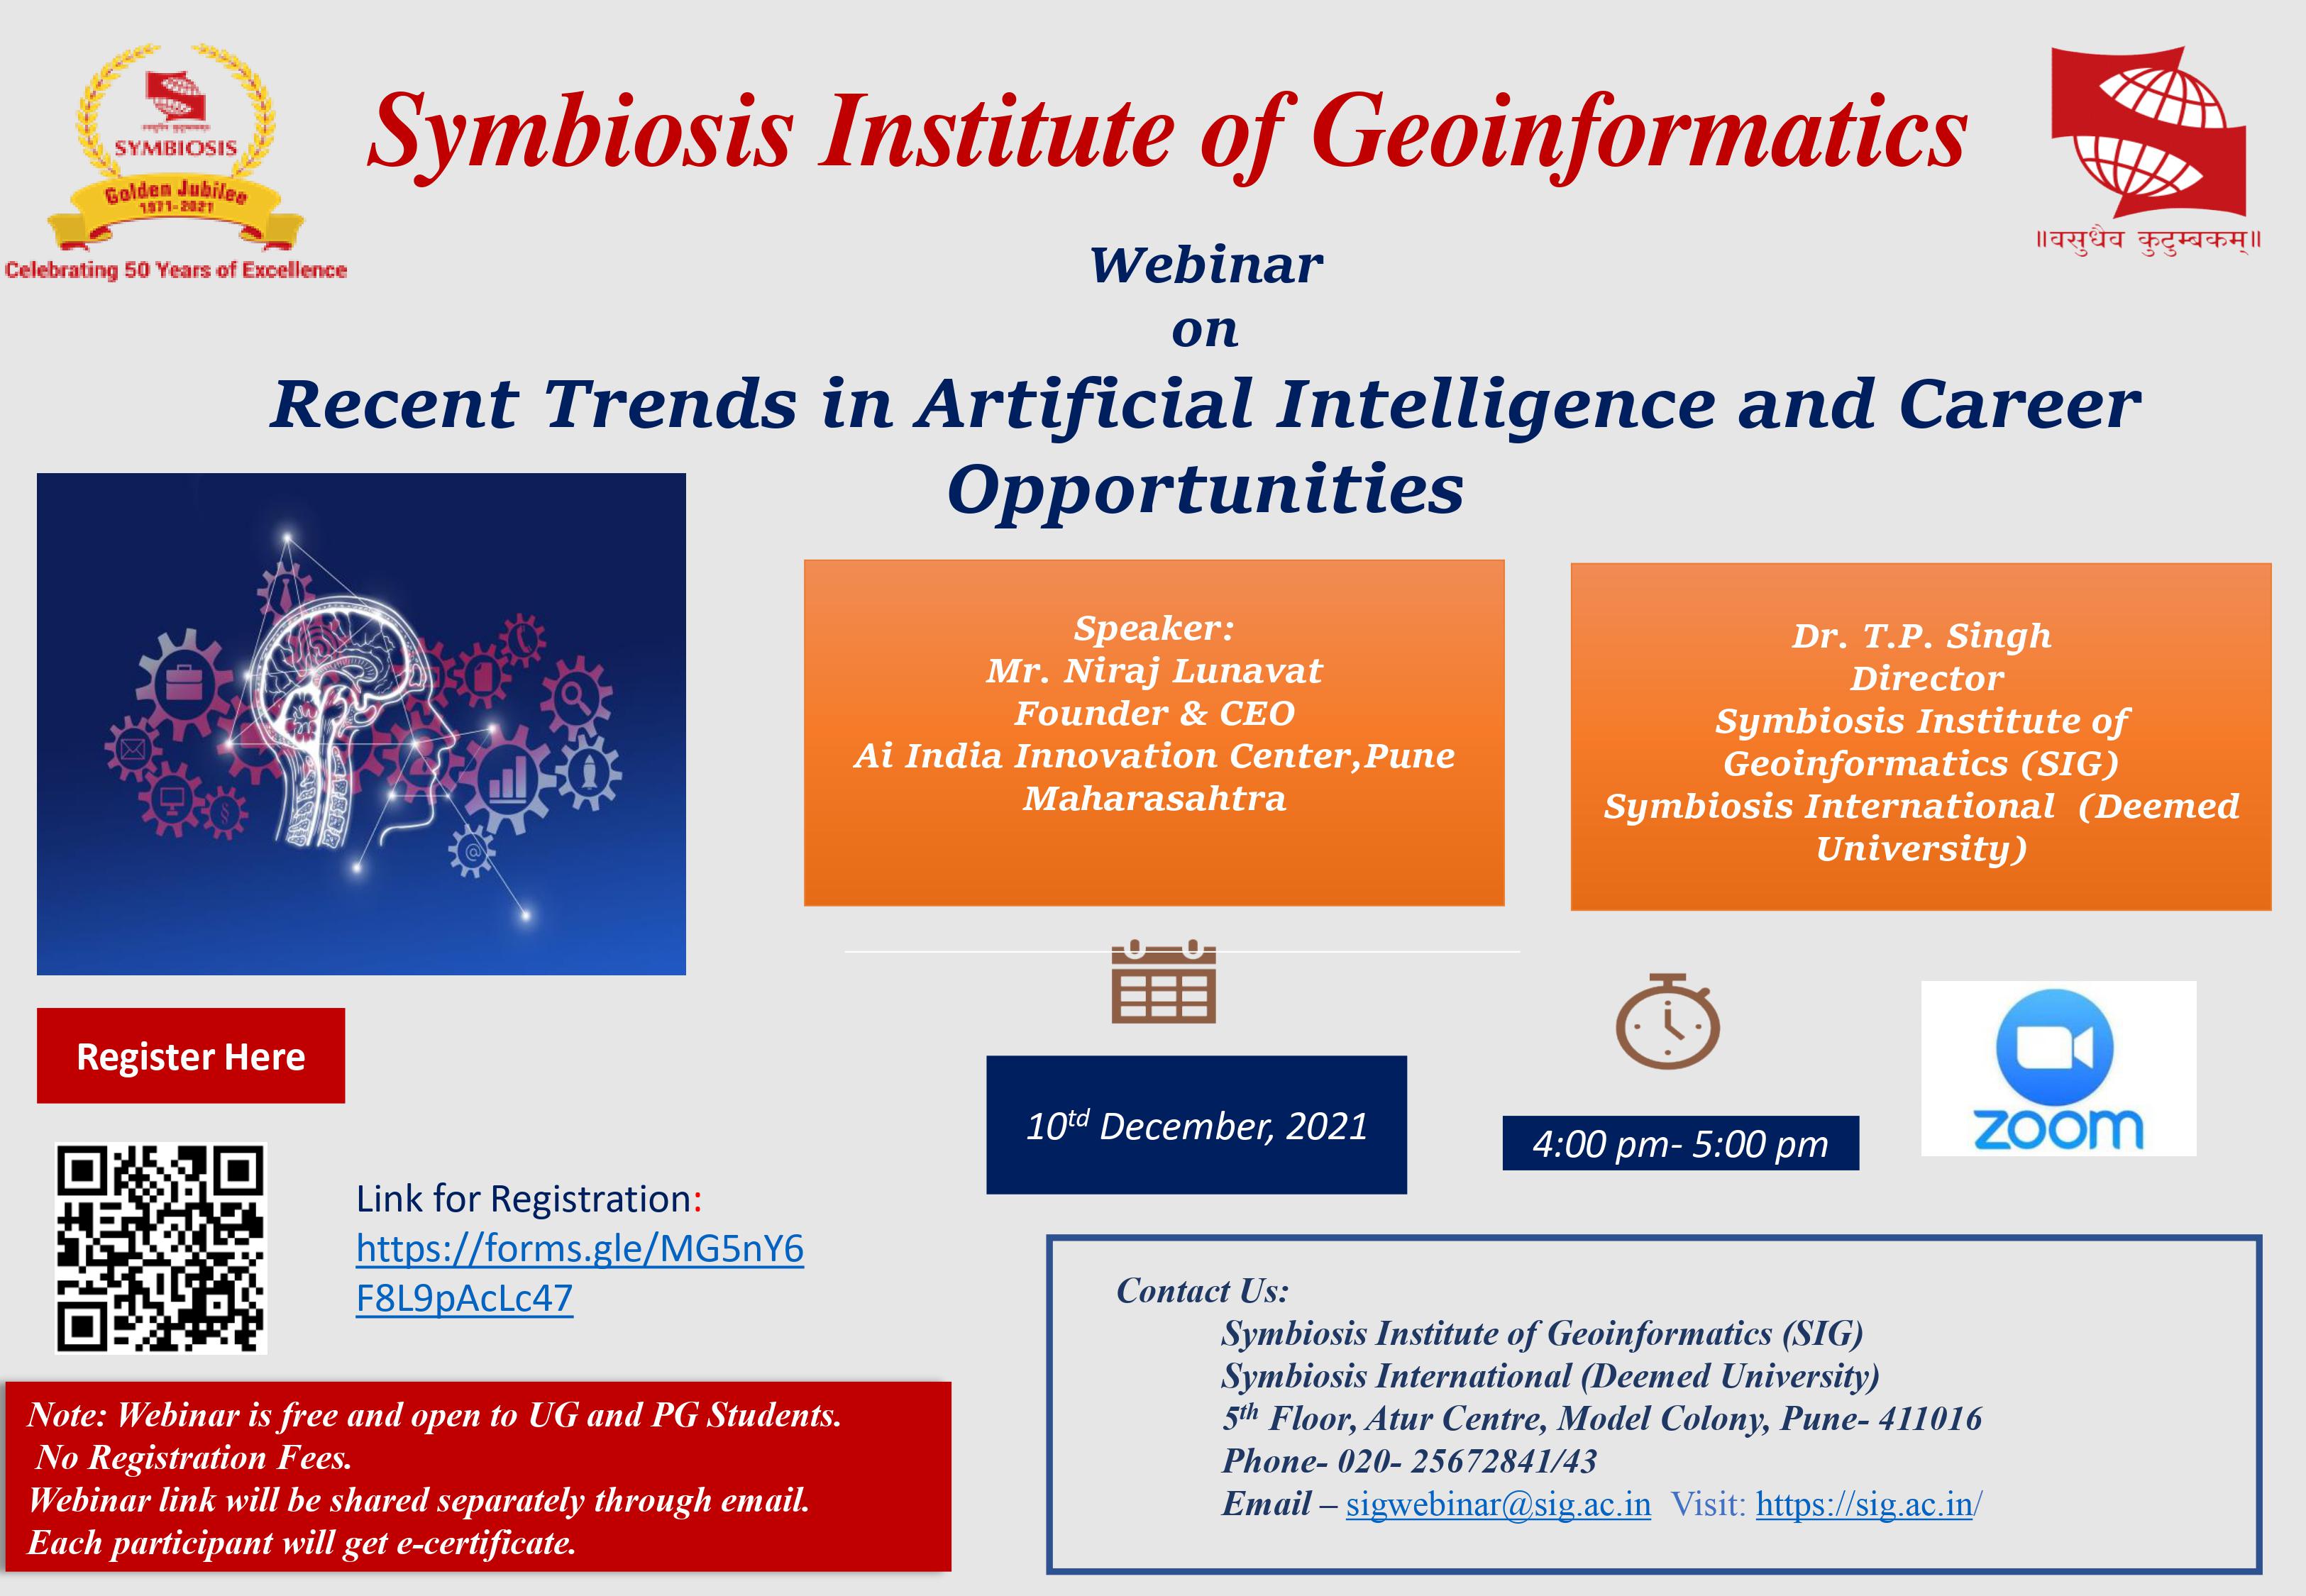
Webinar on Recent Trends in Artificial Intelligence and Career Opportunities

The new Certificate in Data Visualization course is designed to equip students with essential skills in visualizing data using state-of-the-art tools and techniques. This comprehensive program covers fundamental concepts and practical applications, focusing on popular visualization tools like Power-BI, Tableau and Python libraries. Participants will learn how to transform complex datasets into clear, insightful visual representations, enabling better decision-making and communication. The course includes hands-on projects, real-world case studies, and expert guidance, making it ideal for professionals looking to enhance their data analysis capabilities and for beginners aspiring to enter the field of data visualization
The career potential for individuals with expertise in data visualization is robust and continually growing. With the ability to transform complex data into visual stories, professionals in this field can expect opportunities in diverse sectors such as finance, healthcare, technology, marketing, and more. The growing emphasis on big data and analytics ensures that data visualization skills will remain in high demand, offering strong career growth and competitive salaries.
As organizations across industries increasingly rely on data-driven decision-making, the demand for professionals who can effectively interpret and present data is on the rise. Key career paths and opportunities include:
Course Title |
Fundamentals of Data Visualization |
PowerBI for Data Analysis and Visualization |
Tableau for Data Visualization |
Data Visualization using Python |
Applied Data Visualization: Mini Project for Real-World Applications |
3 months
Passed Standard XII (10+2) or equivalent examination from any recognised Board with a minimum of 50% marks or equivalent grade.
The programme fee is Rs. 25,000/- (Rupees Twenty-Five Thousand Only).